Turning Hilbert Curves into Virtual Worlds
Earlier this year a patent I worked on with Helsing was published: EP 4550271 A1 – Computer-Implemented Method for Processing a Multi-Dimensional Spatial Data Representation. Bit of a mouthful, but in plain terms: it is about using space-filling curves (like the Hilbert curve) to conveniently step through satellite data, and place assets (e.g. trees, brush, grass, etc.) in appropriate places.
Why this matters
Helsing is a military AI company. They needed to run realistic, large scale battlefield simulations for reasons ranging from integration testing of their software, to training new models, to replaying military engagements in a sim to see how certain decisions might have impacted the outcome of said engagements. Throughout the bulk of my time there, I was the lead developer on their battlefield simulation software. So, it was my responsibility to ensure these simulations met the company’s needs.
First Steps
We wanted the simulations to be 3D, and realistic. We had access to photo-realistic assets, and a lot of satellite imagery. If you’re unfamiliar with satellite imagery, it’s received in “quadtiles”. This is a hierarchical representation of the map of the world. At the highest level, the world is 1 tile. One level below, it’s 4 tiles, then 16, and so on. Our “asset placement policy” was roughly like so:
- pick an appropriate level of detail (i.e. the right level of quadtiles)
- segment all of the quadtiles into interesting regions (sometimes stitching tiles together for efficiency reasons)
- categorise the segments into different semantic terrain regions (e.g. grassy field, forest, beach, water, etc.)
- place assets across the world such that the appropriate asset was placed in the appropriate terrain type (e.g. trees are placed in forests)
That last point is trickier than you’d think. A realistic environment has complex relationships between the proximity of different assets. For example, some shrubs grow only near certain trees. Sand which naively only appears on the beach would spill over into nearby forest. Even if you don’t care about all the above for a v1, you still don’t want to iterate over the map in a naive for loop as the asset placement ends up looking very regular and your forests start to look more like french vineyards!
You can take things a step further by applying some random x,y displacement as you iterate over the tiles, but then you run into issues at the borders of tiles. You need to step over tile boundaries in order to maintain density heuristics. You also have the annoying problem of needing to maintain density heuristics while only having generated the top half of a tile (when your asset placement should also be affected by the placement of assets you will place in the future, in rows which are below your current one). All of this boils down to a lot of dirty hacks and suboptimal results :(.
The Key Idea
What we’re looking for is a way to step through the satellite imagery in a way that:
- covers the entire quadtile (to avoid patches with no assets)
- maintains density heuristics between assets (to keep mushrooms growing at the base of trees)
- handles boundaries between different terrain types gracefully (so that some fallen logs spill over from a forest onto a nearby beach, and some sand gets into the forest)
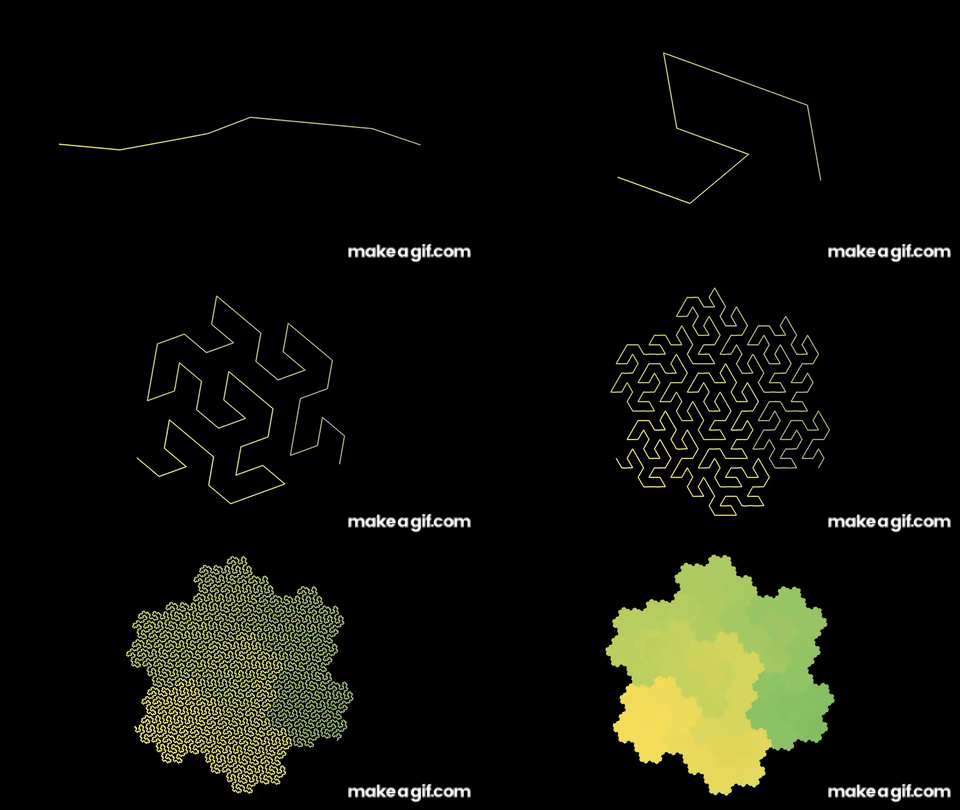
It turns out that space filling curves give us exactly that. The simplest variant takes 1 dimension, and warps it onto a 2D space while preserving locality.

3Blue1Brown animation of a space filling curve from their video on the subject
For each terrain type, and each asset type, we can construct a vector of probabilities which tells us how likely it is for an asset to be placed at a given location in the curve. At every step, based on the terrain we encounter, we can slightly bump the probability of generating assets we haven’t generated in a while, and when we generate an asset, we can mutate related assets’ probabilities to ensure only assets we want near this one spawn next.
The locality preserving characteristics of space filling curves mean that even though we’re stepping through 1D space, the recent placements end up affecting future placements in 2D space. Hence, we’re able to preserve per-object density heuristics, AND complex object proximity rules, all without needing to look outside of our 1-dimensional view of the world!
The Actual Patent Application
In case you want more detail, you should now be in a good position to read and understand the actual patent. As always, feel free to reach out if you’d like to chat more about this :)